

Master Stock Analysis: A Beginner's Guide to Reading Stock Charts
This comprehensive guide helps beginners master stock chart reading, covering candlestick patterns, support and resistance levels, trading volume, and key technical indicators for effective stock analysis.
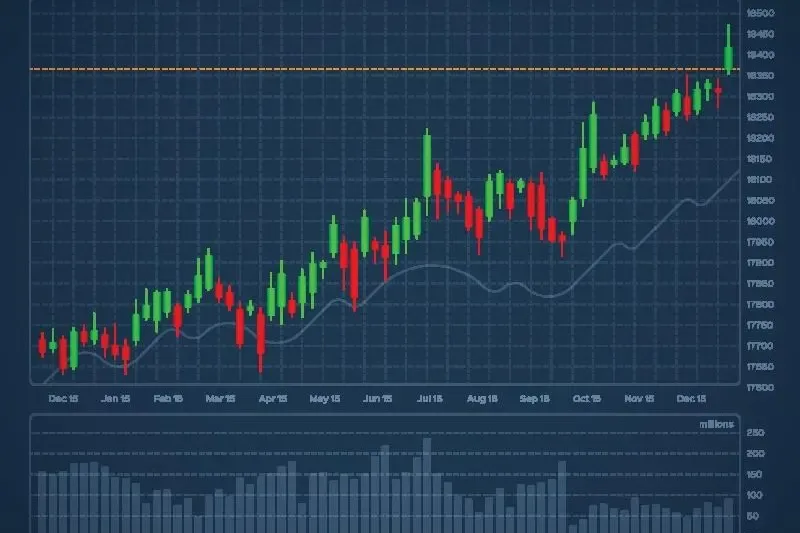
For investors aiming for success in financial markets, the ability to accurately read stock charts is of critical importance. These charts, offering a visual representation of price movements, are indispensable tools for understanding market dynamics and making informed investment decisions. With retail investors now having access to the same real-time price data and charting tools as institutional investors, this competency has become more valuable than ever.
Candlestick charts, one of the most widely used chart types, provide detailed information on open, high, low, and close prices for each specific time period. Green or white candles indicate that the closing price was higher than the opening price (bullish sentiment), while red or black candles signify that the opening price was higher than the closing price (bearish sentiment). This visual richness helps investors quickly grasp market sentiment and the underlying strength of price movements.
Support and resistance levels represent price areas where an asset's price consistently stops falling and bounces back up (support), or repeatedly stops rising and reverses downward (resistance). These levels illustrate how supply and demand forces interact, helping to identify regions where buyers or sellers are likely to dominate the market. Support and resistance points are not exact price points but rather zones where demand and supply can shift, typically identified by analyzing past price actions.
Trading volume measures the number of shares traded within a given period and indicates the conviction behind price movements. A price increase occurring on unusually heavy volume suggests strong broad participation and staying power, whereas the same jump on thin volume might reflect less interest or uncertainty among traders. Volume analysis is a critical indicator for confirming whether a trend has legs or signaling a potential reversal.
Technical indicators such as moving averages, the Relative Strength Index (RSI), and the Stochastic Oscillator also offer additional insights when analyzing price charts. Moving averages help determine trend direction, while RSI indicates whether an asset is in overbought or oversold territory. These indicators, rather than being predictive tools on their own, provide more reliable signals when used in conjunction with price action and volume data.
Technical analysis is a methodology used to forecast future price movements by studying past price action, and it forms a more robust investment strategy when combined with fundamental analysis. Investors can adopt a more systematic approach by assessing long-term trends, marking key support and resistance levels, and confirming price movements with volume. However, no single tool is a magic bullet; continuous learning and integrating various indicators enhance the chances of success in the markets.
Looking ahead, technological advancements will continue to provide investors with more sophisticated charting tools and AI-powered analytical methods. This necessitates the continuous updating and development of market analysis skills. For new investors, acquiring fundamental chart reading skills is a cornerstone of financial literacy and will play a key role in achieving long-term investment goals.
💸 Ready to act on this news?
You need a brokerage account to invest. Compare 30+ trusted brokers in seconds — zero commission options available.
Comments (0)
No comments yet. Be the first to comment!